This page contains most currently known quantitative data sets on web application attack methods, collected as result (and as an addendum) to a discussion on new OWASP Top 10 in early 2013. Note that these data sets are sometimes of very different nature and often cannot be directly compared. Nonetheless, I strongly believe in most cases they give a pretty good picture on how are applications attacked in real life.
Web Hacking Incident Database (WHID)
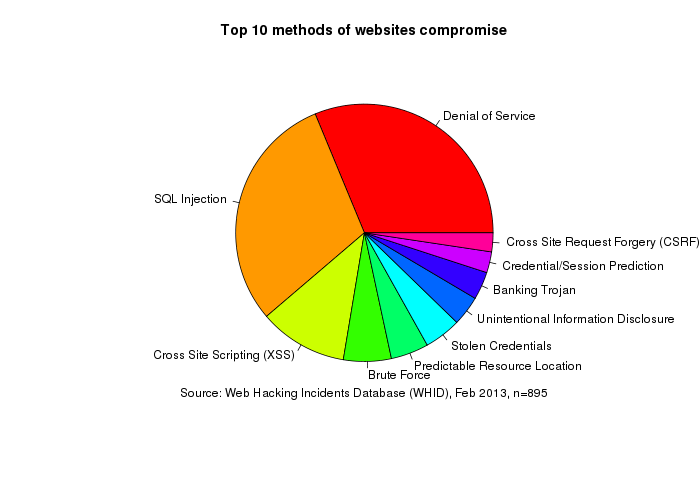
Based on ~1300 hacking or data breach reports published in the news since 2000, updated manually. Some reports cover multiple compromised servers (up to 90'000 at once), but each such campaign is counted as one incident here.
| Attack method | Percentage |
|---|
| Denial of Service | 25% |
| SQL Injection | 24% |
| Cross Site Scripting (XSS) | 8.9% |
| Brute Force | 4.8% |
| Predictable Resource Location | 3.8% |
| Stolen Credentials | 3.7% |
| Unintentional Information Disclosure | 3% |
| Banking Trojan | 2.8% |
| Credential/Session Prediction | 2.1% |
| Cross Site Request Forgery (CSRF) | 1.9% |
Full data (CSV): WHID attack methods count, WHID attack methods percents. Tables at Google: Web-Hacking-Incident-Database. Project page: WebAppSec.org
TrustWave

| Attack method | Percentage |
|---|
| E107 CMS arbitrary code execution | 0.92%
|
| OSCommerce arbitrary file inclusion | 1.4%
|
| SQL injection (SQLi) | 1.77%
|
| Remote File Inclusion (RFI) | 2.58%
|
| PHP-CGI attack | 7.99%
|
| Local File Inclusion (LFI) | 25.93%
|
| Timthumb WordPress plugin PHP code injection | 59.41%
</table>
Source: The Life Cycle of Web Server Botnet Recruitment, 2013
</section>
Imperva
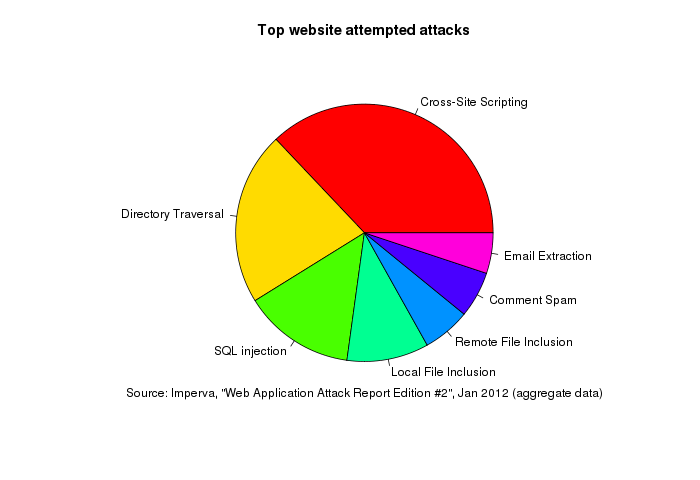
Data on attempted attacks on websites detected by Imperva.
| Attack method | Percentage |
|---|
| Cross-Site Scripting | 37.1% |
| Remote access | 47% |
| Directory Traversal | 21.8% |
| SQL injection | 14% |
| Local File Inclusion | 10.3% |
| Remote File Inclusion | 6% |
| Comment Spam | 5.8% |
| Email Extraction | 5.1% |
Source: Web Application Attack Report Edition #2.
Zone-H
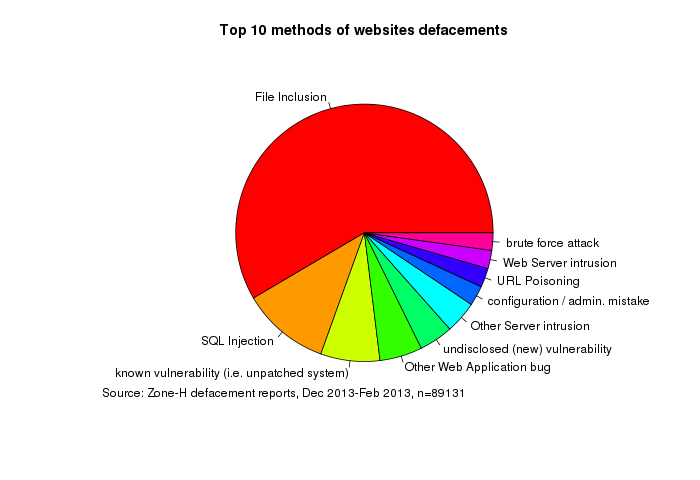
Based on defacement reports published by Zone-H. Covers over 90'000 incidents over three months from Dec 2012 till Feb 2013. The ranking is based on unpublished data which I received courtesy of Zone-H.
| Attack method | Percentage |
|---|
| File Inclusion | 53.5%
| | SQL Injection | 10.1%
| | known vulnerability (i.e. unpatched system) | 6.8%
| | Other Web Application bug | 4.9%
| | undisclosed (new) vulnerability | 3.9%
| | Other Server intrusion | 3.7%
| | configuration / admin. mistake | 2.3%
| | URL Poisoning | 2.2%
| | Web Server intrusion | 2.1%
</table>
Source: zoneh.meth.perc.csv, zoneh.meth.rank.csv.
</section>
Other
| |